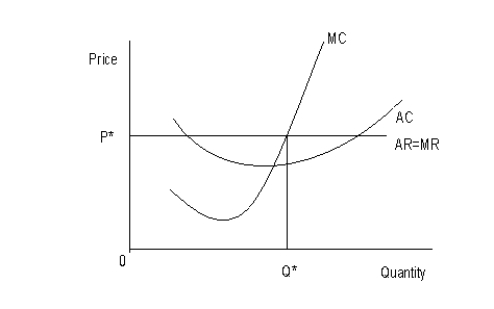
The following figure shows the cost and revenue structures of a firm. MC represents the marginal cost curve, AC represents the average cost curve, AR represents the average revenue curve, and MR represents the marginal revenue curve. P* is the equilibrium price and Q* is the equilibrium output.Figure 9.5
-Suppose Mark invests a sum of $100,000 in a new venture. To fund his investment, Mark withdraws $50,000 from a savings account paying 10% per year and uses the proceeds from a bond that has just matured worth $50,000. If he had reinvested the proceeds from the bond, he could have earned interest at the rate of 5%. Calculate the opportunity cost of capital for Mark in a particular year.
A) $5,000
B) $7,500
C) $10,000
D) $12,500
E) $100,000
Correct Answer:
Verified
Q60: The figure given below shows the revenue
Q61: The following figure shows the cost and
Q62: The following table shows the annual income
Q63: Scenario 9.1
Jane left her job at Siemens
Q64: Scenario 9.1
Jane left her job at Siemens
Q66: The figure given below shows the revenue
Q67: The following figure shows the cost and
Q68: Scenario 9.1
Jane left her job at Siemens
Q69: The figure given below shows the revenue
Q70: The following figure shows the cost and
Unlock this Answer For Free Now!
View this answer and more for free by performing one of the following actions

Scan the QR code to install the App and get 2 free unlocks

Unlock quizzes for free by uploading documents