The figure given below represents the equilibrium real GDP and price level in the aggregate demand and aggregate supply model. Figure 8.3 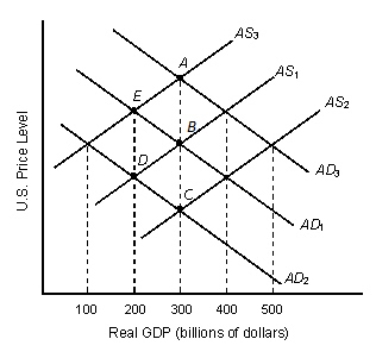 Refer to Figure 8.3.Potential GDP is greater than real GDP at all output levels:
A) above $300 billion.
B) between $300 billion and $400 billion.
C) above $400 billion.
D) below $300 billion.
E) above $500 billion.
Correct Answer:
Verified
Q81: The interest rate effect suggests that investment
Q82: The figure given below represents the equilibrium
Q83: An increase in aggregate demand normally does
Q84: A change in foreign demand does not
Q85: A demand-pull inflation is caused by an
Q87: Government spending is set by the federal
Q88: The figure given below represents the long-run
Q89: Increased household spending reduces aggregate expenditures.
Q90: An increase in the real value of
Q91: The purchase of fifty new food-processing machines
Unlock this Answer For Free Now!
View this answer and more for free by performing one of the following actions

Scan the QR code to install the App and get 2 free unlocks

Unlock quizzes for free by uploading documents