The figure given below represents the equilibrium real GDP and price level in the aggregate demand and aggregate supply model. Figure 8.3 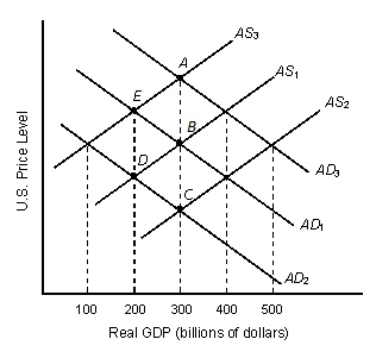 Refer to Figure 8.3.Movement from point B to point D could be initiated by:
A) a stock market crash that undermines consumer confidence.
B) a tax code changes that improve investor expectations.
C) a national emergency that increases government spending.
D) a higher net exports because of economic expansion in European countries.
E) a technological advancement.
Correct Answer:
Verified
Q77: The intersection of the aggregate demand and
Q78: In the 1970s the international price of
Q79: Which of the following is true of
Q80: The movement of the vertical _ curve
Q81: The interest rate effect suggests that investment
Q83: An increase in aggregate demand normally does
Q84: A change in foreign demand does not
Q85: A demand-pull inflation is caused by an
Q86: The figure given below represents the equilibrium
Q87: Government spending is set by the federal
Unlock this Answer For Free Now!
View this answer and more for free by performing one of the following actions

Scan the QR code to install the App and get 2 free unlocks

Unlock quizzes for free by uploading documents