The below figure shows the various combinations of the goods X and Y that yield different levels of utility. Figure 6.3 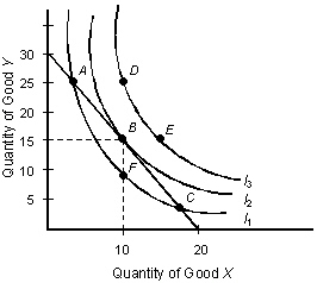 In Figure 6.3, the consumer is in equilibrium at point:
A) A
B) B
C) C
D) D
E) E
Correct Answer:
Verified
Q81: The table below shows the total utility
Q84: The table below shows the total utility
Q84: The figure given below represents two indifference
Q86: The below indifference map shows the various
Q92: An indifference curve shows _.
A)the relationship between
Q92: The below figure shows the various combinations
Q97: The table below shows the total utility
Q109: The below indifference map shows the various
Q111: The below indifference map shows the various
Q117: When the budget line is just tangent
Unlock this Answer For Free Now!
View this answer and more for free by performing one of the following actions

Scan the QR code to install the App and get 2 free unlocks

Unlock quizzes for free by uploading documents