The figure given below represents two indifference curves I1 and I2 of an individual. Figure 6.2 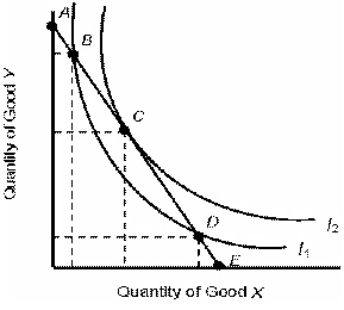 Refer to Figure 6.2.At which point in the figure above will the consumer maximize satisfaction?
A) A
B) B
C) C
D) D
E) E
Correct Answer:
Verified
Q64: The table below shows the total utility
Q81: The below figure shows the various combinations
Q81: Buyers who are persuaded to take a
Q81: The table below shows the total utility
Q82: The below figure shows the various combinations
Q84: The table below shows the total utility
Q89: The below figure shows the various combinations
Q92: An indifference curve shows _.
A)the relationship between
Q96: The table below shows the total utility
Q109: The below indifference map shows the various
Unlock this Answer For Free Now!
View this answer and more for free by performing one of the following actions

Scan the QR code to install the App and get 2 free unlocks

Unlock quizzes for free by uploading documents