The below figure shows the various combinations of the goods X and Y that yield different levels of utility. Figure 6.3 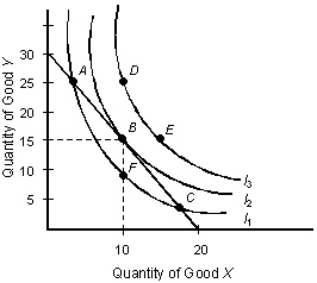 In Figure 6.3, if the price of one unit of good X and good Y is $30 and $20, respectively, the consumer's income is _____.
A) $50
B) $150
C) $400
D) $600
E) $900
Correct Answer:
Verified
Q64: The table below shows the total utility
Q67: The table given below reports the total
Q72: Suppose the price of beef declines by
Q77: The table below shows the total utility
Q81: Buyers who are persuaded to take a
Q81: The table below shows the total utility
Q82: The below figure shows the various combinations
Q84: The figure given below represents two indifference
Q96: The table below shows the total utility
Q109: The below indifference map shows the various
Unlock this Answer For Free Now!
View this answer and more for free by performing one of the following actions

Scan the QR code to install the App and get 2 free unlocks

Unlock quizzes for free by uploading documents