The figure given below represents the equilibrium price and output in the market for restaurant meals and delivery meals. Figure 4.1 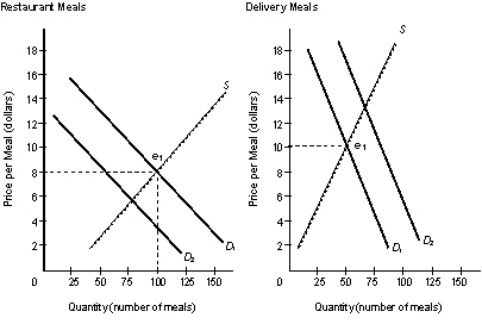 Refer to Figure 4.1.The demand for Restaurant Meals shift in one direction while the demand for Delivery Meals shift in another direction.Which of the following impacts will it have on the quantity of Restaurant Meals and Delivery meals purchased by consumers?
A) The quantity of Restaurant Meals purchased declines while the quantity of Delivery Meals purchased rises.
B) The quantity of Restaurant Meals purchased rises while the quantity of Delivery Meals purchased declines.
C) Both the quantity of Restaurant Meals purchased and the quantity of Delivery Meals purchased declines.
D) Both the quantity of Restaurant Meals purchased and the quantity of Delivery Meals purchased increases.
E) The quantity of Restaurant Meals purchased and the quantity of Delivery Meals purchased add up to 100.
Correct Answer:
Verified
Q1: Which of the following situations is an
Q2: Which of the following correctly describes the
Q6: The market process by which new products
Q9: In a market system,who ultimately determines what
Q11: The figure given below represents the equilibrium
Q13: Firms try to minimize costs and maximize
Q16: The figure given below represents the equilibrium
Q16: Mark's ability to purchase goods and services
Q17: The figure given below represents the equilibrium
Q20: Identify the correct reason behind the rise
Unlock this Answer For Free Now!
View this answer and more for free by performing one of the following actions

Scan the QR code to install the App and get 2 free unlocks

Unlock quizzes for free by uploading documents