The figure given below represents the equilibrium price and output in the market for restaurant meals and delivery meals. Figure 4.1 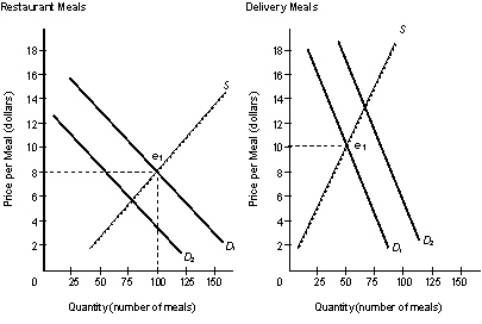 Refer to Figure 4.1.Identify the impact on the price of Restaurant Meals and Delivery Meals following the direction of the shifts in demand in these two industries.
A) The price of Restaurant Meals rises while the price of Delivery Meals declines.
B) The price of both Restaurant Meals and Delivery Meals declines.
C) The price of Restaurant Meals declines while the price of Delivery Meals rises.
D) The price of both Restaurant Meals and Delivery Meals rises.
E) The price of Restaurant Meals and the price of Delivery Meals add up to $10.
Correct Answer:
Verified
Q4: The resources owned by firms that shut
Q8: The wireless communication business has changed dramatically
Q9: In a market system,who ultimately determines what
Q11: The figure given below represents the equilibrium
Q13: Firms try to minimize costs and maximize
Q13: The figure given below represents the equilibrium
Q16: Mark's ability to purchase goods and services
Q17: The figure given below represents the equilibrium
Q20: Identify the correct reason behind the rise
Q22: In a market system,which of the following
Unlock this Answer For Free Now!
View this answer and more for free by performing one of the following actions

Scan the QR code to install the App and get 2 free unlocks

Unlock quizzes for free by uploading documents