An operations management professor is interested in how her students performed on her midterm exam.The histogram shown below represents the distribution of exam scores (where the maximum score is 100)for 50 students. 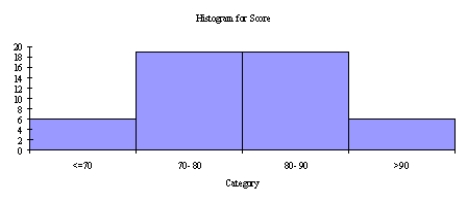 Based on this histogram,how would you characterize the students' performance on this exam?
Correct Answer:
Verified
View Answer
Unlock this answer now
Get Access to more Verified Answers free of charge
Q67: Suppose that an analysis of a set
Q81: The histogram below represents scores achieved by
Q85: How many job applicants scored between 10
Q89: How many job applicants scored above 50?
Q89: The data below represents monthly sales for
Q90: Based on the histogram shown below,how would
Q91: Is the distribution of the number of
Q92: A question of great interest to economists
Q94: Based on the histogram shown below,how would
Q99: The histogram below represents scores achieved by
Unlock this Answer For Free Now!
View this answer and more for free by performing one of the following actions

Scan the QR code to install the App and get 2 free unlocks

Unlock quizzes for free by uploading documents