What does the graph below indicate about the normality of our data? 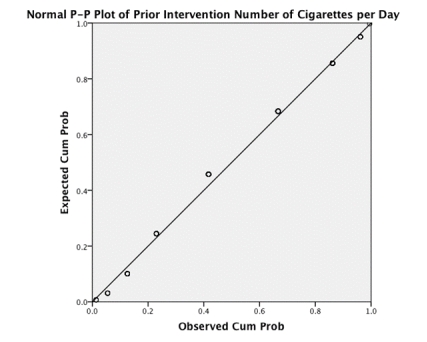
A) We cannot infer anything about the normality of our data from this type of graph.
B) The P-P plot reveals that the data deviate mildly from normal.
C) The P-P plot reveals that the data are normal.
D) The P-P plot reveals that the data deviate substantially from normal.
Correct Answer:
Verified
Q15: 15,467 people rated how much they liked
Q16: What does the graph below indicate about
Q17: The test statistics we use to assess
Q18: In which of the following situations is
Q19: Which of the following symbols does
Q21: In a small data sample (N =
Q22: The central limit theorem tells us:
A)In small
Q23: Looking at the table below, which of
Q24: A researcher investigating 'Pygmalion in the classroom'
Q25: Levene's test can be used to measure:
A)Whether
Unlock this Answer For Free Now!
View this answer and more for free by performing one of the following actions

Scan the QR code to install the App and get 2 free unlocks

Unlock quizzes for free by uploading documents