What does the graph below indicate about the normality of our data? 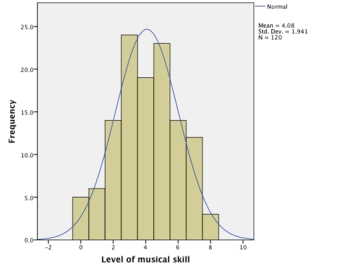
A) The histogram reveals that the data have multivariate normality.
B) We cannot infer anything about the normality of our data from this graph.
C) The histogram reveals that the data are more or less normal.
D) The histogram reveals that the data deviate substantially from normal.
Correct Answer:
Verified
Q11: A standard score is:
A)A z-score
B)The standard deviation
Q12: A _ is a numerical characteristic of
Q13: Which of these variables would be considered
Q14: Is it possible to calculate the skewness
Q15: 15,467 people rated how much they liked
Q17: The test statistics we use to assess
Q18: In which of the following situations is
Q19: Which of the following symbols does
Q20: What does the graph below indicate about
Q21: In a small data sample (N =
Unlock this Answer For Free Now!
View this answer and more for free by performing one of the following actions

Scan the QR code to install the App and get 2 free unlocks

Unlock quizzes for free by uploading documents