Which describes the figure of logistic population growth shown in the graph?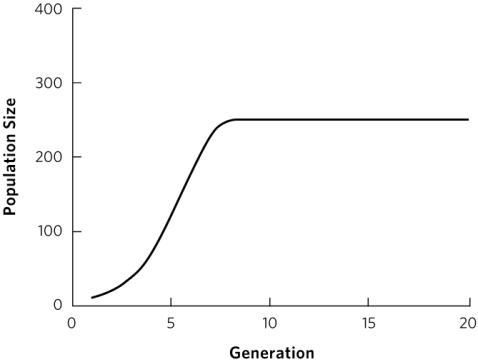
A) r > 0; K > 300
B) r < 0; K > 300
C) r > 0; K < 300
D) r < 0; K < 300
Correct Answer:
Verified
Q22: The logistic growth model describes a maximum
Q26: In the logistic growth model, which term
Q30: Which factors could limit a species' carrying
Q31: In the logistic growth model, in which
Q31: The larvae of a carnivorous species of
Q33: You are a biologist studying a small
Q34: A park biologist is planting saplings (young
Q36: The graph shows one possible answer; students
Unlock this Answer For Free Now!
View this answer and more for free by performing one of the following actions

Scan the QR code to install the App and get 2 free unlocks

Unlock quizzes for free by uploading documents