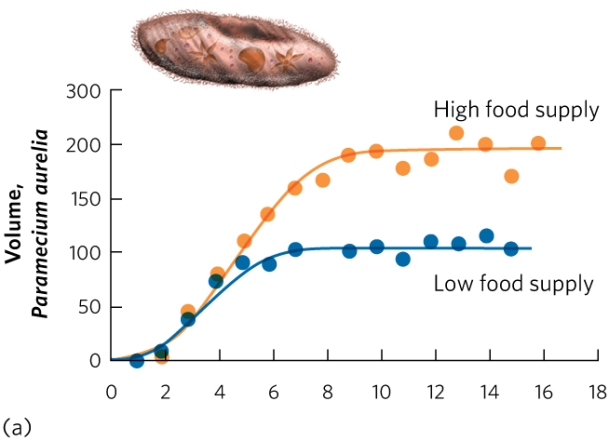
-The figure shows the change in population size of Paramecium from Gause's experiment, raised in either high-food or low-food conditions. Based on this figure, how was the logistic growth model for Paramecium changed by adding food?
A) High food increased r.
B) High food decreased r.
C) High food increased K.
D) High food decreased K.
Correct Answer:
Verified
Q26: In the logistic growth model, which term
Q30: Which factors could limit a species' carrying
Q31: The larvae of a carnivorous species of
Q32: Which accurately describes the inflection point in
Q34: Which describes the figure of logistic population
Q36: The graph shows one possible answer; students
Q36: The age structure of a population is
Q41: A biologist is studying a population of
Q42: The following table shows the survival and
Q44: Applying life tables to sea turtle conservation
Unlock this Answer For Free Now!
View this answer and more for free by performing one of the following actions

Scan the QR code to install the App and get 2 free unlocks

Unlock quizzes for free by uploading documents