The graph shows the extinction rates for families of marine organisms over different periods of Earth's history. What is the best estimate for the background extinction rate given these data? 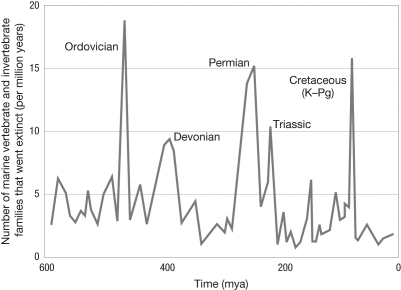
A) 14-20 families per million years
B) 8-12 families per million years
C) 2-5 families per million years
D) 2-20 families per million years
Correct Answer:
Verified
Q5: Extinction of a species means that
A) all
Q6: Which of the following observations would be
Q7: What particular trait made it more likely
Q8: A native species of wildflower belonging to
Q9: For much of the Cretaceous, bivalves belonging
Q11: The figure below shows the increasing morphological
Q12: The graph shows extinction rates for families
Q13: Which of the following is the greatest
Q14: Native plant A is endangered. You suspect
Q15: Why are endemic species particularly at risk
Unlock this Answer For Free Now!
View this answer and more for free by performing one of the following actions

Scan the QR code to install the App and get 2 free unlocks

Unlock quizzes for free by uploading documents