The graph shows extinction rates for families of marine organisms during different periods of Earth's history. How many mass extinction events do scientists commonly infer from these data? 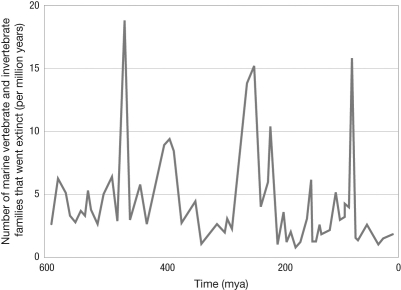
A) 2
B) 13
C) 5
D) 3
Correct Answer:
Verified
Q7: What particular trait made it more likely
Q8: A native species of wildflower belonging to
Q9: For much of the Cretaceous, bivalves belonging
Q10: The graph shows the extinction rates for
Q11: The figure below shows the increasing morphological
Q13: Which of the following is the greatest
Q14: Native plant A is endangered. You suspect
Q15: Why are endemic species particularly at risk
Q16: While studying a group of ammonites
Q17: Where would you place the actual extinction
Unlock this Answer For Free Now!
View this answer and more for free by performing one of the following actions

Scan the QR code to install the App and get 2 free unlocks

Unlock quizzes for free by uploading documents