The figure shows the Ka /Ks values for two regulatory genes in pairs of species in (A) North American tarweeds and (B) Hawaiian silverswords. The dashed lines are the mean Ka/Ks values. What do these data indicate about how these genes are evolving differently in these two groups of taxa? A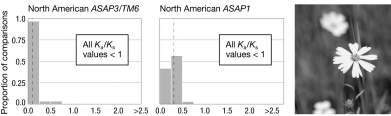
B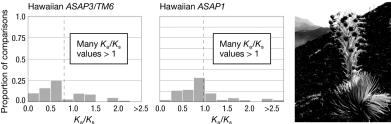
A) They are evolving neutrally in the tarweeds and under purifying selection in the silverswords.
B) There have been more mutations in this gene in the silverswords than the tarweeds.
C) They have experienced purifying selection in the tarweeds and positive selection in the silverswords.
D) They have undergone gene conversion in the tarweeds but not in the silverswords.
Correct Answer:
Verified
Q29: Consider a population of size Ne with
Q30: A population of fruit flies was maintained
Q31: When both mutation and genetic drift are
Q32: In a diploid population, the threshold at
Q33: The neutral theory of molecular evolution posits
Q35: Consider a population of 10,000 pigeons founded
Q36: When both drift and selection are acting
Q37: Imagine that, of three species, it is
Q38: If neutral mutations occur at the rate
Q39: The figure shows aligned homologous gene sequences
Unlock this Answer For Free Now!
View this answer and more for free by performing one of the following actions

Scan the QR code to install the App and get 2 free unlocks

Unlock quizzes for free by uploading documents