The figure shows the allele frequency trajectories for two populations starting from two different initial frequencies. Which evolutionary processes could produce this result? 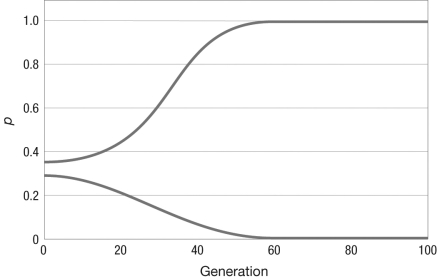
A) underdominance or positive frequency-dependent selection
B) underdominance or overdominance
C) negative frequency-dependent selection or mutation-selection balance
D) directional selection only
Correct Answer:
Verified
Q1: Which of the following is an assumption
Q3: Pocket mice have light- or dark-colored coats
Q4: A sample of 2,000 individuals from a
Q5: What kind of equilibrium does overdominance produce?
A)
Q6: Stalk height in sunflowers is determined by
Q7: Natural selection can act on both _,
Q8: The table shows the survival and seed
Q9: Consider a locus with two alleles, A
Q10: Consider two events that are mutually exclusive,
Q11: The figure shows the change in allele
Unlock this Answer For Free Now!
View this answer and more for free by performing one of the following actions

Scan the QR code to install the App and get 2 free unlocks

Unlock quizzes for free by uploading documents