The figure shown is a phylogeny created with DNA sequence data and has high bootstrap support values. The tree also includes observed phenotypes (in varying shades of gray) for the five taxa. The character states are indicated by "B" or "b," "G" or "g," and "P" or "p." Evaluate the hypothetical phylogenetic tree using a parsimony approach. What is the minimum total number of state changes necessary to describe the observed distribution of characters in the taxa? 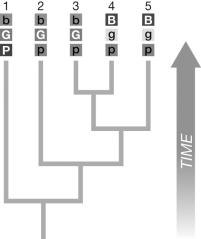
A) four
B) five
C) six
D) seven
Correct Answer:
Verified
Q32: From the DNA sequence data for the
Q33: The figure shown is a phylogeny created
Q34: The figure shown is a phylogeny created
Q35: Why do some evolutionary biologists have philosophical
Q36: DNA sequences are the most frequently used
Q38: Why do evolutionary biologists say that Tiktaalik
Q39: In the spring of 1999, six medics
Q40: The method of independent contrasts
A) allows evolutionary
Q41: An unrooted tree linking three species (A,
Q42: In a paragraph, describe the data shown
Unlock this Answer For Free Now!
View this answer and more for free by performing one of the following actions

Scan the QR code to install the App and get 2 free unlocks

Unlock quizzes for free by uploading documents