The figure shown is a phylogeny created with DNA sequence data, but it is NOT well-supported with bootstrap analysis; in other words, all clades of the tree have very low (<50%) bootstrap values. The tree also includes observed phenotypes (in varying shades of gray) for the five taxa. The character states are indicated by "B" or "b," "G" or "g," and "P" or "p." Evaluate the hypothetical phylogenetic tree using a parsimony approach. If a more parsimonious tree were to be drawn based only on phenotypes (excluding the DNA data) , which of the following would be grouped as sister taxa on the new tree? 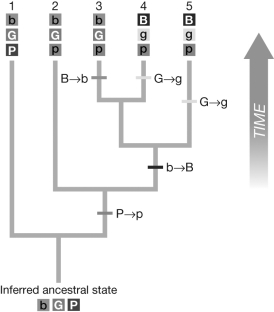
A) taxa 1 and 2
B) taxa 1 and 3
C) taxa 2 and 3
D) taxa 2 and 4
Correct Answer:
Verified
Q29: The figure shown is a phylogeny created
Q30: If the two daughters share no possible
Q31: Evolutionary biologists have developed a number of
Q32: From the DNA sequence data for the
Q33: The figure shown is a phylogeny created
Q35: Why do some evolutionary biologists have philosophical
Q36: DNA sequences are the most frequently used
Q37: The figure shown is a phylogeny created
Q38: Why do evolutionary biologists say that Tiktaalik
Q39: In the spring of 1999, six medics
Unlock this Answer For Free Now!
View this answer and more for free by performing one of the following actions

Scan the QR code to install the App and get 2 free unlocks

Unlock quizzes for free by uploading documents