The figure shows the relationships between oldfield mice populations. Light-colored beach populations are shown with a triangle; dark-colored inland populations are shown with circles. Which of the following statements is consistent with this phylogeny? 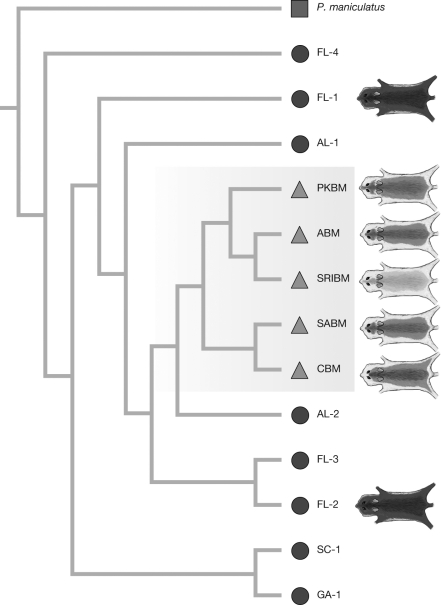
A) Light coat color arose multiple times independently in different beach populations.
B) The light-coat allele arose prior to colonization of beach populations.
C) Natural selection favors light coat color when the Mc1R allele is mutated.
D) Dark-colored populations are derived from migrants from the beach populations.
Correct Answer:
Verified
Q1: Spines, flowers, and a waxy stem coating
Q3: The figure shows the wing length of
Q4: The figure indicates a _ between the
Q5: In a study of life history evolution
Q6: All of the following are types of
Q7: The formal definition of "fitness" in evolutionary
Q8: In guppy populations that experience low predation
Q9: A trait that serves one purpose today
Q10: The 2000-2004 drought in California dramatically shortened
Q11: Natural selection acts on _ differences in
Unlock this Answer For Free Now!
View this answer and more for free by performing one of the following actions

Scan the QR code to install the App and get 2 free unlocks

Unlock quizzes for free by uploading documents