Both sea surface (below) and air temperature (above) show a warming period beginning in 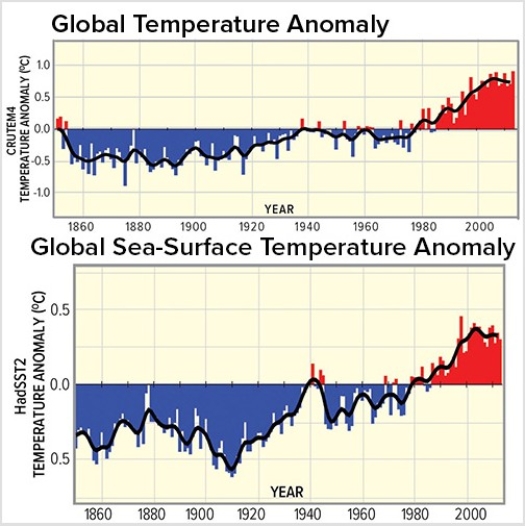
A) 1860.
B) 1940.
C) 1980.
D) 2010.
Correct Answer:
Verified
Q55: The SO₂emissions displayed in this map derive
Q56: Solid aerosols
A)create secondary pollutants and destroy the
Q57: Between 1960 and 2010,atmospheric greenhouse CO₂has increased
Q58: Atmospheric temperatures are influenced by all of
Q59: The main National Academy of Science conclusion
Q61: The biggest loss of sea ice between
Q62: General Circulation Models (GCM)
A)use data collected exclusively
Q63: A higher proportion of white daisies on
Q64: The accompanying graph shows the number of
Q65: A higher proportion of black daisies on
Unlock this Answer For Free Now!
View this answer and more for free by performing one of the following actions

Scan the QR code to install the App and get 2 free unlocks

Unlock quizzes for free by uploading documents