The accompanying graph shows the number of violent tornados in the last 60 years.Based on when most global warming has occurred,one would conclude 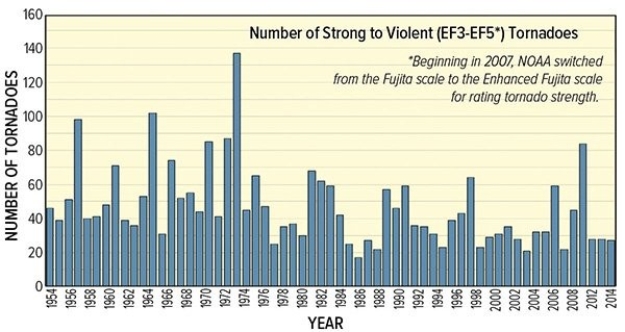
A) global warming has had a major impact on the number of tornados.
B) global warming has had a major impact on the number of tornados in the early part of the century.
C) global warming has had a major impact on the number of tornados since 2000.
D) global warming has not had an impact on the number of tornados.
Correct Answer:
Verified
Q59: The main National Academy of Science conclusion
Q60: Both sea surface (below)and air temperature (above)show
Q61: The biggest loss of sea ice between
Q62: General Circulation Models (GCM)
A)use data collected exclusively
Q63: A higher proportion of white daisies on
Q65: A higher proportion of black daisies on
Q66: Which of the following is a correct
Q67: Ultimately,positive and negative feedbacks on Daisy World
Q68: In the last 200 years,sea level has
Q69: This globe,from the opening two-page spread of
Unlock this Answer For Free Now!
View this answer and more for free by performing one of the following actions

Scan the QR code to install the App and get 2 free unlocks

Unlock quizzes for free by uploading documents