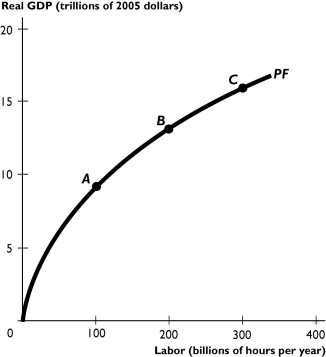
-The figure above shows the U.S.production function.How would an increase in income taxes be shown in the figure?
A) a movement from point C to point B
B) a movement from point A to point B
C) an upward shift or rotation of the production function
D) a downward shift or rotation of the production function
E) None of the above because the effects of an increase in taxes cannot be shown in the figure.
Correct Answer:
Verified
Q281: Define potential GDP.Under what circumstances does actual
Q291: Q292: If the government increases unemployment benefits,then the Q293: Define the production function.Discuss why the production Q294: Economic growth in Cuba has been slow;what Unlock this Answer For Free Now! View this answer and more for free by performing one of the following actions Scan the QR code to install the App and get 2 free unlocks Unlock quizzes for free by uploading documents![]()

