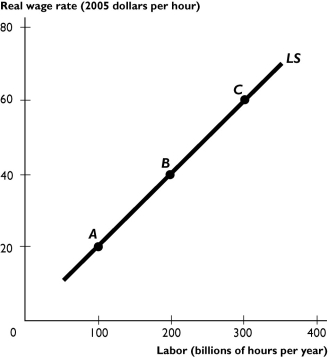
-The figure above shows the U.S.supply of labor curve.What was the affect of the decline in birth rates during the 1960s and 1970s on the supply of labor curve in the 1980s?
A) a rightward shift of the supply of labor curve
B) the supply of labor curve became steeper
C) a movement downward along the supply of labor curve from a point such as A to a point such as B
D) a leftward shift of the supply of labor curve
E) None of the above answers is correct because there was no change in the supply of labor curve.
Correct Answer:
Verified
Q291: Q292: If the government increases unemployment benefits,then the Q293: Define the production function.Discuss why the production Q294: Economic growth in Cuba has been slow;what Unlock this Answer For Free Now! View this answer and more for free by performing one of the following actions Scan the QR code to install the App and get 2 free unlocks Unlock quizzes for free by uploading documents![]()

