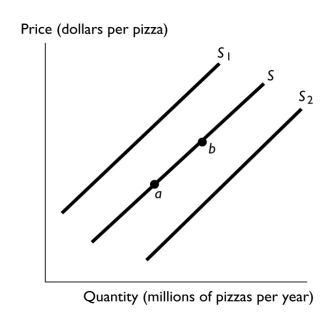
-In the above figure,the shift in the supply curve from S to S2 reflects
A) an increase in the quantity of pizza supplied.
B) a decrease in the quantity of pizza supplied.
C) an increase in the supply of pizza.
D) a decrease in the supply of pizza.
E) a decrease in the supply of pizza and a simultaneous decrease in the quantity of pizza supplied.
Correct Answer:
Verified
Q102: Milk can be used to produce cheese
Q103: Plywood is used in the construction of
Q104: A decrease in the price of a
Q114: Which of the following does NOT increase
Q117: When the price of oranges increases,
A) the
Q122: Q124: Which of the following shifts the supply Q128: The number of corn producers increases,so the![]()
Unlock this Answer For Free Now!
View this answer and more for free by performing one of the following actions

Scan the QR code to install the App and get 2 free unlocks

Unlock quizzes for free by uploading documents