Multiple Choice
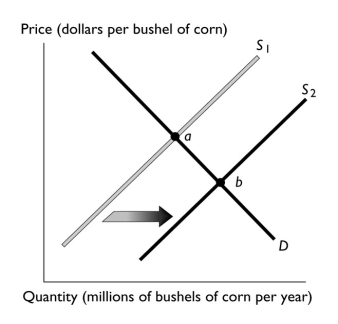
-The above figure illustrates the market for corn.If point "a" represents the original equilibrium and point "b" the new equilibrium,which of the following could have caused the change?
A) a decrease in the number of corn growers
B) a decrease the price of wheat,a substitute in production for corn
C) an increase in the cost of the seed used to grow the corn
D) a decrease in buyers' incomes if corn is an inferior good
E) an increased belief among buyers that corn is healthy
Correct Answer:
Verified
Related Questions
Q102: Milk can be used to produce cheese
Q103: Plywood is used in the construction of
Q104: A decrease in the price of a
Q114: Which of the following does NOT increase

