Multiple Choice
Figure 11-3 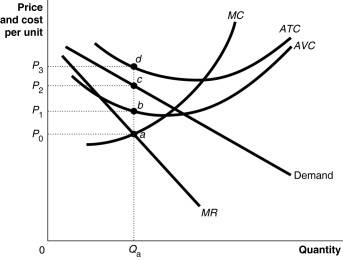 Figure 11-3 shows short-run cost and demand curves for a monopolistically competitive firm in the market for designer watches.
-Refer to Figure 11-3.What is the area that represents the loss made by the firm?
A) the area P0adP3
B) the area P1bcP2
C) the area P0acP2
D) the area P2cdP3
Correct Answer:
Verified
Related Questions
Q41: Figure 11-5 Q43: Figure 11-4 Q46: Figure 11-3 Q50: Central Grocery in New Orleans is famous![]()
![]()
![]()

