Figure 11-5 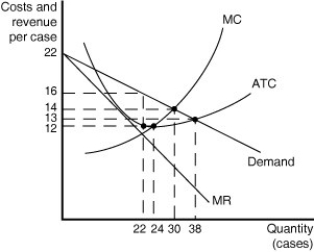 Figure 11-5 shows cost and demand curves for a monopolistically competitive producer of iced-tea.
-Refer to Figure 11-5.to answer the following questions.
a.What is the profit-maximizing output level?
b.What is the profit-maximizing price?
c.At the profit-maximizing output level,how much profit will be realized?
d.Does this graph most likely represent the long run or the short run? Why?
Correct Answer:
Verified
View Answer
Unlock this answer now
Get Access to more Verified Answers free of charge
Q38: Figure 11-3 Q43: Figure 11-4 Q45: Figure 11-3 Q46: Figure 11-3 Q52: If marginal revenue is negative then the Q54: Explain the differences between total revenue, average Q61: Table 11-3 Q63: What is the profit-maximizing rule for a Q67: Table 11-2 Q116: Arturo runs a Taco Bell franchise.He is Unlock this Answer For Free Now! View this answer and more for free by performing one of the following actions Scan the QR code to install the App and get 2 free unlocks Unlock quizzes for free by uploading documents![]()
![]()
![]()
![]()

