A sketch of the free energy for a hypothetical chemical equilibrium is shown here. What part of the plot on the axis representing the relative quantities of reactants and products corresponds to a value of Q that is less than K? 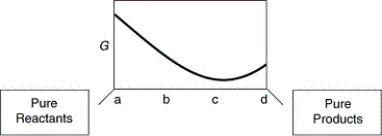
A) a to b
B) b to c
C) a to c
D) b to d
E) c to d
Correct Answer:
Verified
Q69: A qualitative interpretation of the effect
Q70: A sketch of the free energy versus
Q72: Which of the following figures illustrates best
Q75: A perturbation or stress to a chemical
Q77: What is the value of the
Q78: As T approaches infinity, lnK approaches _
A)
Q85: For a particular hypothetical reaction, 2A
Q103: As the temperature of an endothermic
Q104: Jane can accept that
Q131: The prediction of linearity in a
Unlock this Answer For Free Now!
View this answer and more for free by performing one of the following actions

Scan the QR code to install the App and get 2 free unlocks

Unlock quizzes for free by uploading documents