Which of the following figures illustrates best the sequence of the free-energy values (shown with the star) for a chemical reaction at equilibrium to the removal of products, followed by the response of the equilibrium to this stress?
A) 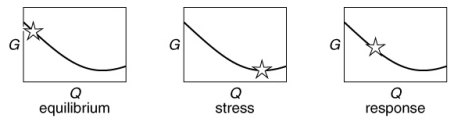
B) 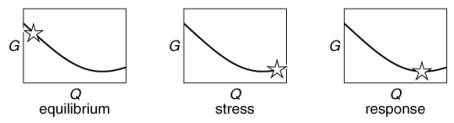
C) 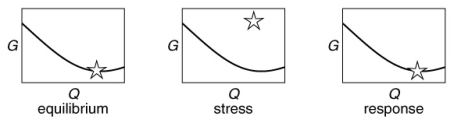
D) 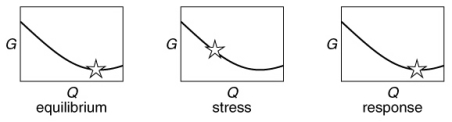
Correct Answer:
Verified
Q69: A qualitative interpretation of the effect
Q70: A sketch of the free energy versus
Q73: A sketch of the free energy for
Q75: A perturbation or stress to a chemical
Q77: What is the value of the
Q85: For a particular hypothetical reaction, 2A
Q103: As the temperature of an endothermic
Q104: Jane can accept that
Q131: The prediction of linearity in a
Q132: The equilibrium constant for a given reaction
Unlock this Answer For Free Now!
View this answer and more for free by performing one of the following actions

Scan the QR code to install the App and get 2 free unlocks

Unlock quizzes for free by uploading documents