The following figures represent distributions of two types of gas molecules between two containers connected by an open tube. In which figure is the entropy of the system maximized?
A) 
B) 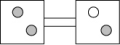
C) 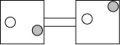
D) 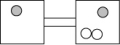
Correct Answer:
Verified
Q3: What is the entropy change to the
Q27: Perfect crystals of carbon monoxide (CO) are
Q28: Which of the processes A-D will lead
Q29: Which of the following processes will lead
Q30: The standard molar entropy of lead(II) bromide
Q33: Indicate which of the following has the
Q34: The following figures represent distributions of gas
Q35: Indicate which one of the following
Q39: Consider a closed container containing a 1
Q44: The entropy of a NaCl crystal is
Unlock this Answer For Free Now!
View this answer and more for free by performing one of the following actions

Scan the QR code to install the App and get 2 free unlocks

Unlock quizzes for free by uploading documents