Which of the following graphs best depicts the entropy of a pure substance as the temperature is raised from its solid form through its liquid and gaseous forms?
A) 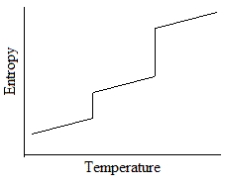
B) 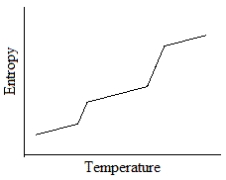
C) 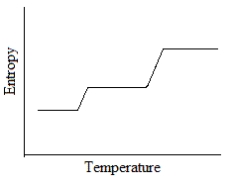
D) 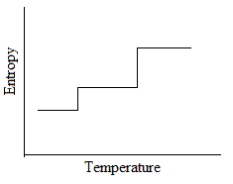
Correct Answer:
Verified
Q3: What is the entropy change to the
Q7: If 1 mol of ice melts at
Q29: Which of the following is in the
Q33: Indicate which of the following has the
Q34: The following figures represent distributions of gas
Q35: Indicate which one of the following
Q39: Indicate which one of the following
Q42: Processes are always spontaneous when _
Q44: The entropy of a NaCl crystal is
Q67: A reaction with a low enthalpy
Unlock this Answer For Free Now!
View this answer and more for free by performing one of the following actions

Scan the QR code to install the App and get 2 free unlocks

Unlock quizzes for free by uploading documents