Refer to the diagram below: 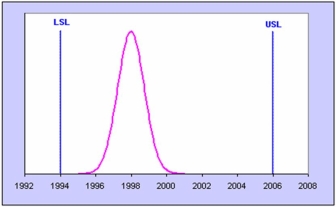 For this process,the Cp index would be:
A) less than one.
B) equal to one.
C) greater than one.
Correct Answer:
Verified
Q41: Which is not a true statement about
Q51: The R chart is likely to reveal
Q55: Likely reasons for inaccurate control limits would
Q60: In statistical process control, control charts are
Q62: Find the Cpk index for a process
Q63: Statistical process control charts can measure:
A)the stability
Q63: Ten samples of n = 5 were
Q65: Which is not a rule of thumb
Q65: Find the Cp index for a process
Q67: Ten samples of n = 5 were
Unlock this Answer For Free Now!
View this answer and more for free by performing one of the following actions

Scan the QR code to install the App and get 2 free unlocks

Unlock quizzes for free by uploading documents