Ten samples of n = 5 were collected to construct an  chart.The sample mean and range for each sample are shown in the table below.
 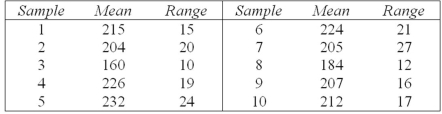 Calculate the empirical lower and upper control limits for the
  chart (you will need a table of control chart factors) .
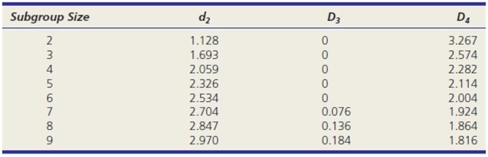
A) 196.46,217.34
B) 171.81,241.39
C) 188.03,225.17
D) 163.64,250.56
Correct Answer:
Verified
Q62: Find the Cpk index for a process
Q62: Refer to the diagram below: 
Q63: Ten samples of n = 5 were
Q65: Find the Cp index for a process
Q65: Which is not a rule of thumb
Q68: Which is not a characteristic of a
Q70: Professor Murphy wants to set up a
Q73: Which statistician developed the 14 Points of
Q78: Which is not a characteristic of instability?
A)Larger
Q80: Which is not characteristic of a trend?
A)Variance
Unlock this Answer For Free Now!
View this answer and more for free by performing one of the following actions

Scan the QR code to install the App and get 2 free unlocks

Unlock quizzes for free by uploading documents