Multiple Choice
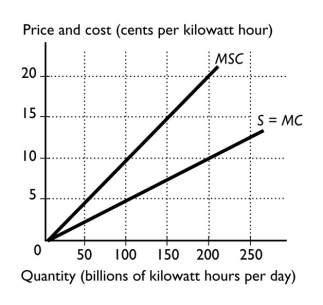
-The figure above shows the marginal social cost curve of generating electricity and the marginal private cost curve.The marginal cost borne by producers when 200 billion kilowatt hours are produced is
A) 0¢ per kilowatt.
B) 10¢ per kilowatt.
C) 20¢ per kilowatt.
D) 15¢ per kilowatt.
E) 5¢ per kilowatt.
Correct Answer:
Verified
Related Questions

