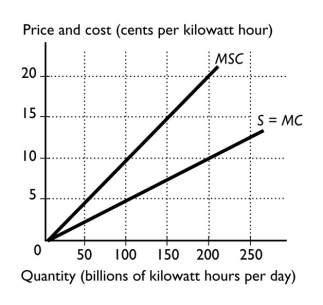
-The figure above shows the marginal social cost curve of generating electricity and the marginal private cost curve.The marginal cost paid by the producers and everyone else in society when 200 billion kilowatt hours are produced is
A) 0¢ per kilowatt.
B) 10¢ per kilowatt.
C) 20¢ per kilowatt.
D) 15¢ per kilowatt.
E) 5¢ per kilowatt.
Correct Answer:
Verified
Q66: The proposition that if property rights exist
Q67: One reason why property rights help achieve
Q68: Q69: Q70: Q72: Legally established titles to the ownership,use,and disposal Q73: Q74: If transactions costs are low,then assigning property Q75: If a producer must pay the cost Q76: Unlock this Answer For Free Now! View this answer and more for free by performing one of the following actions Scan the QR code to install the App and get 2 free unlocks Unlock quizzes for free by uploading documents![]()
![]()
![]()
![]()
![]()

