The figure below shows the market for macaroni:
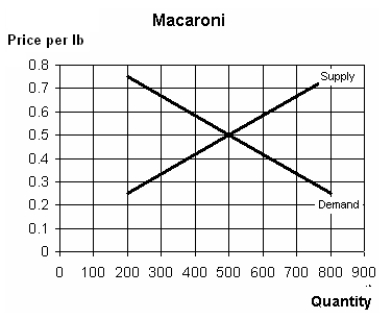 (a.) What is the equilibrium price and quantity?
(b.) At what price shown on the graph would there be an excess demand for macaroni? What would be the size of this excess demand?
(c.) At what price shown on the graph would there be an excess supply of macaroni? What would be the size of this excess supply?
Correct Answer:
Verified
View Answer
Unlock this answer now
Get Access to more Verified Answers free of charge
Q69: Using the diagram below explain what will
Q70: Suppose you want to buy a popular
Q71: The table below shows the supply and
Q72: A new medical study reports that washing
Q73: Suppose that, last year, the price of
Q75: Suppose that the local hospital claims that
Q76: Using the diagram below explain why it
Q77: Land in the South can often be
Q78: Explain how price adjusts to eliminate excess
Q79: You attend a rock concert and notice
Unlock this Answer For Free Now!
View this answer and more for free by performing one of the following actions

Scan the QR code to install the App and get 2 free unlocks

Unlock quizzes for free by uploading documents