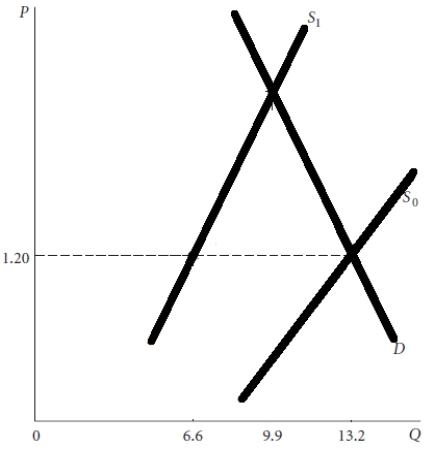
Using the diagram below explain what will happen to equilibrium price and quantity if the supply curve shifts to the left as depicted from So to S2.
Correct Answer:
Verified
View Answer
Unlock this answer now
Get Access to more Verified Answers free of charge
Q64: If incomes grow during the next year,
Q65: A decrease in the demand for eggs
Q66: Comment on the following statement: "A decrease
Q67: In 1999, both the equilibrium price and
Q68: Some people will often remark that the
Q70: Suppose you want to buy a popular
Q71: The table below shows the supply and
Q72: A new medical study reports that washing
Q73: Suppose that, last year, the price of
Q74: The figure below shows the market for
Unlock this Answer For Free Now!
View this answer and more for free by performing one of the following actions

Scan the QR code to install the App and get 2 free unlocks

Unlock quizzes for free by uploading documents