Refer to the information provided in Figure 11.1 below to answer the questions that follow. 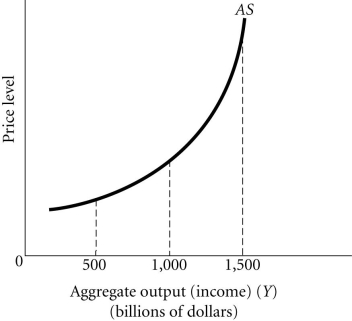 Figure 11.1
-Refer to Figure 11.1. This economy is most likely experiencing costs increasing as fast as output prices are increasing at aggregate output levels
A) above $1,500 billion.
B) between $1,000 billion and $1,500 billion.
C) between $500 billion and $1,000 billion.
D) below $500 billion.
Correct Answer:
Verified
Q7: Refer to the information provided in Figure
Q8: Refer to the information provided in Figure
Q9: Refer to the information provided in Figure
Q10: The aggregate supply curve
A) is the sum
Q11: Refer to the information provided in Figure
Q13: If the economy is operating on the
Q14: Refer to the information provided in Figure
Q15: Refer to the information provided in Figure
Q16: The graph that shows the relationship between
Q17: If the economy is operating way below
Unlock this Answer For Free Now!
View this answer and more for free by performing one of the following actions

Scan the QR code to install the App and get 2 free unlocks

Unlock quizzes for free by uploading documents