Refer to the information provided in Figure 11.2 below to answer the questions that follow. 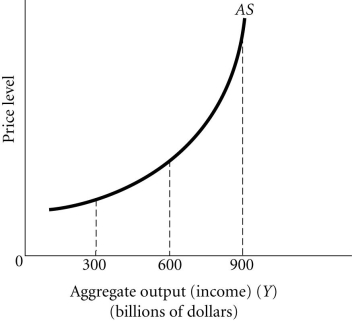 Figure 11.2
-Refer to Figure 11.2. Between the output levels of $300 billion and $600 billion, the relationship between the price level and output is
A) negative.
B) positive.
C) constant.
D) There is no relationship between the price level and output.
Correct Answer:
Verified
Q2: The quantity of output supplied at different
Q3: When the aggregate supply curve is vertical,
Q4: Refer to the information provided in Figure
Q5: Refer to the information provided in Figure
Q6: Refer to the information provided in Figure
Q8: Refer to the information provided in Figure
Q9: Refer to the information provided in Figure
Q10: The aggregate supply curve
A) is the sum
Q11: Refer to the information provided in Figure
Q12: Refer to the information provided in Figure
Unlock this Answer For Free Now!
View this answer and more for free by performing one of the following actions

Scan the QR code to install the App and get 2 free unlocks

Unlock quizzes for free by uploading documents