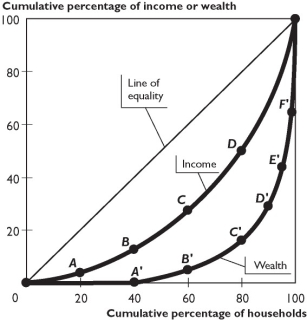
The figure above shows Lorenz curves for a nation.
-Based on the figure above,if the poorest 20 percent group of households increased the share of the nation's income they receive,then
A) there is a movement up along the Lorenz curve for income.
B) there is a movement down along the Lorenz curve for income.
C) the Lorenz curve for income shifts toward the line of equality.
D) the Lorenz curve for income shifts away from the line of equality.
E) Both answers A and C are correct.
Correct Answer:
Verified
Q19: What is a Lorenz curve?
Q129: Which of the following statements correctly describes
Q130: Q131: Q132: Q134: In the United States,do the poorest 20 Q135: The median voter theory predicts income redistribution Unlock this Answer For Free Now! View this answer and more for free by performing one of the following actions Scan the QR code to install the App and get 2 free unlocks Unlock quizzes for free by uploading documents![]()
![]()
![]()

