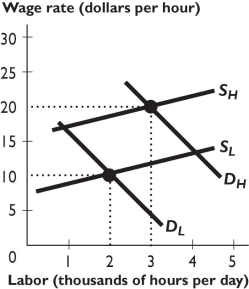
The figure above shows the demand and supply curves for high-skilled (indicated by an "H" subscript) and low-skilled (indicated by an "L" subscript) workers.
-In the figure above,the compensation for the cost of acquiring the skill creates the difference between the ________ curves and ________.
A) SL and SH; is equal to $10 per hour
B) SL and SH; is less than $10 per hour
C) DL and DH; is less than $10 per hour
D) DL and DH; is equal to $10 per hour
E) SL and SH; exceeds $10 per hour
Correct Answer:
Verified
Q132: Q133: Q134: In the United States,do the poorest 20 Q135: The median voter theory predicts income redistribution Q138: Suppose a state charges an in-state student Unlock this Answer For Free Now! View this answer and more for free by performing one of the following actions Scan the QR code to install the App and get 2 free unlocks Unlock quizzes for free by uploading documents![]()
![]()

