Which of the following graphs represents the magnitude of the electric field as a function of the distance from the center of a solid charged conducting sphere of radius R? 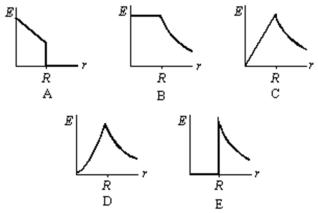
A) A
B) B
C) C
D) D
E) E
Correct Answer:
Verified
Q32: A conducting sphere of radius 0.01 m
Q33: A hollow conductor is positively charged.A small
Q34: 10 C of charge are placed on
Q35: A 300-N/C uniform electric field points perpendicularly
Q36: A conducting sphere of radius 5.0 cm
Q38: Positive charge Q is placed on a
Q39: Two large insulating parallel plates carry positive
Q40: Two large conducting parallel plates carry charge
Q41: Charge Q is distributed uniformly throughout
Q42: Positive charge Q is distributed uniformly
Unlock this Answer For Free Now!
View this answer and more for free by performing one of the following actions

Scan the QR code to install the App and get 2 free unlocks

Unlock quizzes for free by uploading documents