Multiple Choice
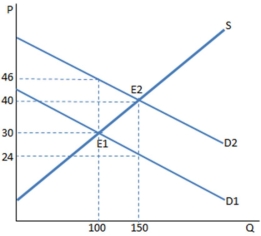 The graph shown portrays a subsidy to buyers. Before the subsidy is put in place, the producers sold _____ units and received _____ for each of them.
A) 100; $46
B) 100; $30
C) 150; $40
D) 150; $24
Correct Answer:
Verified
Related Questions

