Multiple Choice
 The graph shown portrays a subsidy to buyers. The subsidy causes:
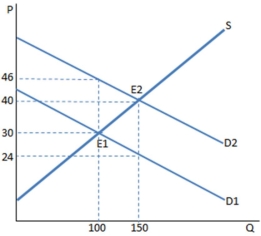
A) 50 more units to be sold in this market.
B) 150 more units to be sold in this market.
C) 100 fewer units to be sold in this market.
D) 50 fewer units to be sold in this market.
Correct Answer:
Verified
Related Questions

