Multiple Choice
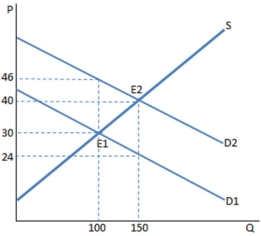 The graph shown portrays a subsidy to buyers. Once the subsidy is in place, the buyers pay _____ and the sellers receive ________; the difference is ___________.
A) $24; $40; the amount of the subsidy
B) $30; $46; the amount of the subsidy
C) $40; $24; the amount of the subsidy
D) $24; $40; the amount of government revenue
Correct Answer:
Verified
Related Questions

