This graph depicts the demand for a normal good. 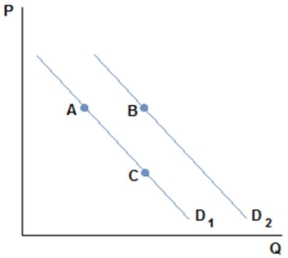 A movement from A to C in the graph shown might be caused by:
A) an increase in price.
B) a decrease in price.
C) an increase in income.
D) a decrease in income.
Correct Answer:
Verified
Q46: An expectation of increased prices of a
Q53: Demand for Snickers bars will decrease if:
A)
Q54: A decrease in the price of spaghetti
Q58: The latest news report stated that the
Q60: An increase in the price of Heinz
Q62: Which of the following would not affect
Q65: This graph depicts the demand for a
Q72: Roy just got a big promotion at
Q78: An increase in the price of ice
Q92: Wendell just read an article that says
Unlock this Answer For Free Now!
View this answer and more for free by performing one of the following actions

Scan the QR code to install the App and get 2 free unlocks

Unlock quizzes for free by uploading documents