This graph depicts the demand for a normal good. 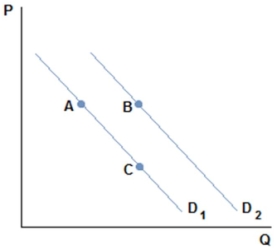 A shift from B to A in the graph shown might be caused by:
A) a decrease in the good's price.
B) an increase in the good's price.
C) a decrease in the price of a substitute.
D) an increase in the price of a substitute.
Correct Answer:
Verified
Q60: An increase in the price of Heinz
Q61: This graph depicts the demand for a
Q62: Which of the following would not affect
Q63: Ray's company just announced that everyone will
Q66: There has been an increase in the
Q72: Roy just got a big promotion at
Q75: There has been a decrease in the
Q78: An increase in the price of ice
Q79: Tom was out shopping for a sweater
Q92: Wendell just read an article that says
Unlock this Answer For Free Now!
View this answer and more for free by performing one of the following actions

Scan the QR code to install the App and get 2 free unlocks

Unlock quizzes for free by uploading documents