The following data show the demand for an airline ticket dependent on the price of this ticket. 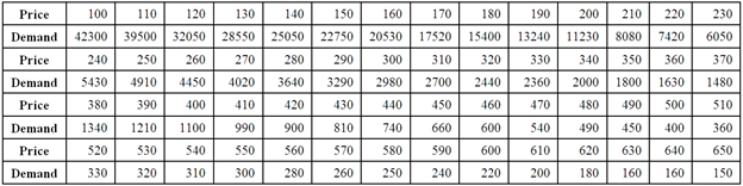 For the assumed cubic and log-log regression models,Demand = β0 + β1Price + β2Price2 + β3Price3 + ε and ln(Demand) = β0 + β1ln(Price) + ε,the following regression results are available.
 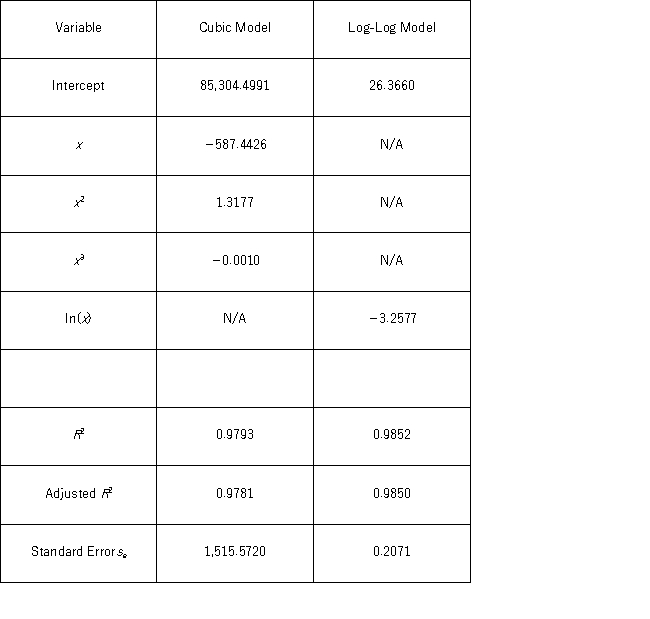 Which of the following does the slope of the obtained log-log regression equation
  = 26.3660 - 3.2577 ln(Price) signify?
A) For every 1% increase in the price,the predicted demand declines by approximately 3.2577%.
B) For every 1% increase in the demand,the expected price increases by approximately 3.2577%.
C) For every 1% increase in the demand,the expected price decreases by approximately 3.2577%.
D) For every 1% increase in the price,the predicted demand increases by approximately 3.2577%.
Correct Answer:
Verified
Q58: A model in which the response variable
Q59: The following Excel scatterplot with the fitted
Q60: A model with one explanatory variable being
Q61: The following data,with the corresponding Excel scatterplot,show
Q62: The following data show the demand for
Q64: The following data,with the corresponding Excel scatterplot,show
Q65: The following data show the demand for
Q66: The logarithmic and log-log models,y = β0
Q67: The following data show the demand for
Q68: Which of the following regression models is
Unlock this Answer For Free Now!
View this answer and more for free by performing one of the following actions

Scan the QR code to install the App and get 2 free unlocks

Unlock quizzes for free by uploading documents