A researcher analyzes the relationship between amusement park attendance and the price of admission.She estimates the following model:  ,where Attendance is the daily attendance (in 1000s)and Price is the gate price (in $).A portion of the regression results is shown in the accompanying table.
 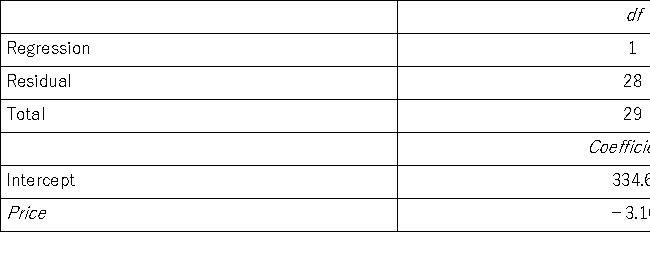 a.Predict the Attendance for an amusement park that charges $80 for admission.
b.Interpret the slope coefficient attached to Price.
c.Calculate the standard error of the estimate.If the sample mean for Attendance is 75.9,what can you infer about the model's predictive power.
d.Calculate and interpret the coefficient of determination.How much of the variability in Attendance is unexplained.
Correct Answer:
Verified
View Answer
Unlock this answer now
Get Access to more Verified Answers free of charge
Q124: A portfolio manager is interested in reducing
Q125: Consider the following sample data.: 
Q126: An analyst examines the effect that various
Q127: An economist examines the relationship between the
Q128: A statistics instructor wants to examine the
Q130: Which of the following is the relationship
Q131: The following ANOVA table was obtained when
Q132: The following portion of regression results was
Q133: The following portion of regression results was
Q134: An investment analyst wants to examine the
Unlock this Answer For Free Now!
View this answer and more for free by performing one of the following actions

Scan the QR code to install the App and get 2 free unlocks

Unlock quizzes for free by uploading documents